This article was written by Benji Andrews on December 15, 2023 and published by Benetech.
Benetech’s Benji Andrews, Ron Ellis, Pruthvi Patel, Amreen Poonawala, and Matthew Yip deep dive into Benetech’s inaugural Kaggle competition that explores the intersection of AI and education through innovative graph transcription solutions.
The Opportunity
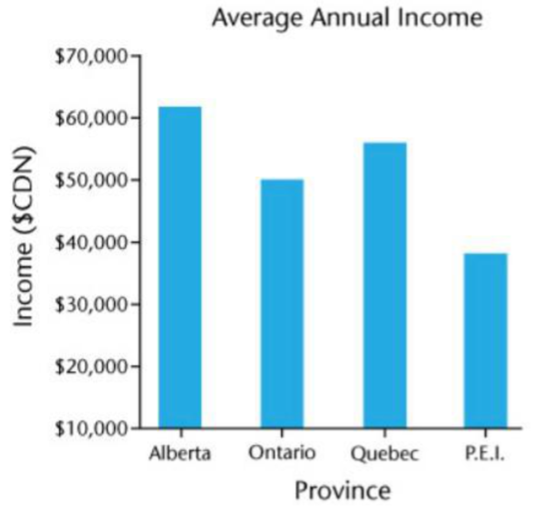
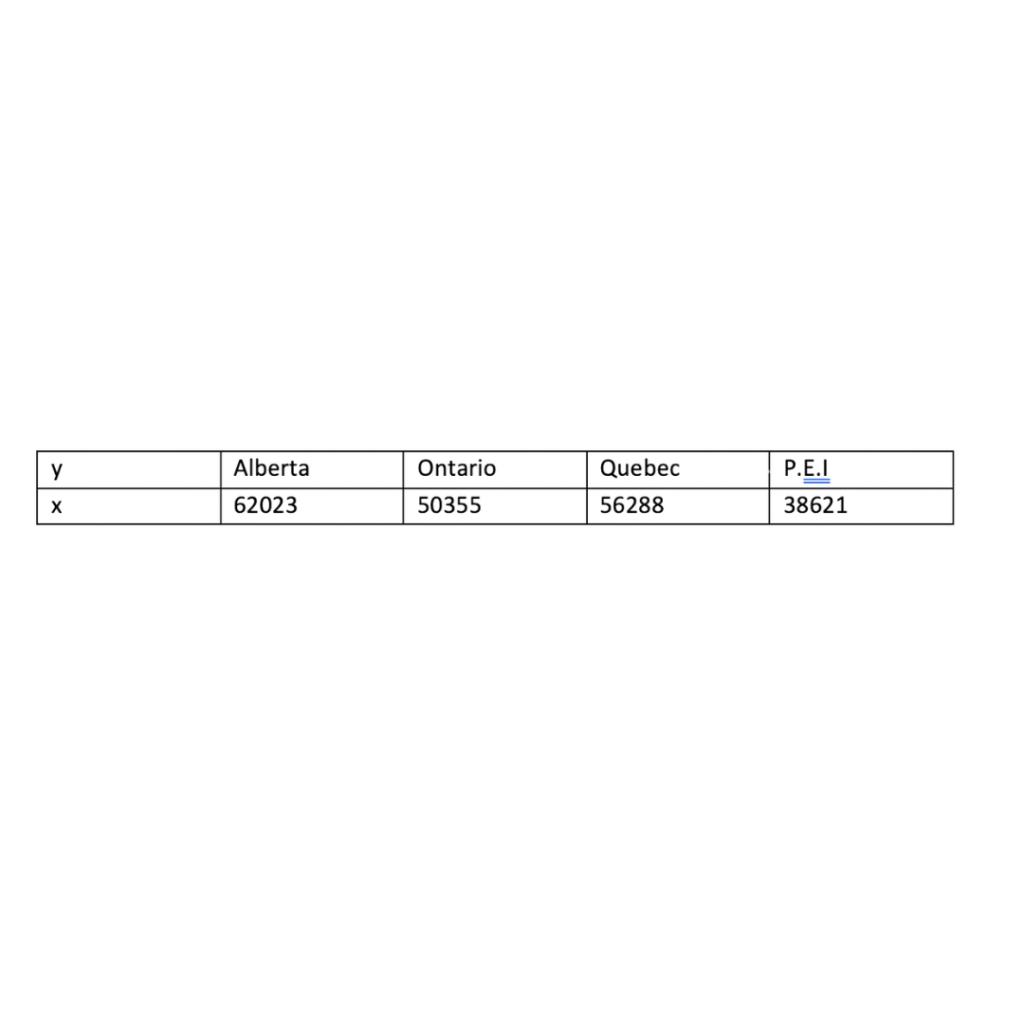
When it comes to converting image-based learning materials into an accessible format, charts and graphs present a unique challenge. While undoubtedly an important part of learning, these visual elements can be especially difficult to translate because of their diverse utility. Charts and graphs can function as references, visually supplement points discussed in the surrounding text, or as instructional examples in subsequent learning. The Poet Image Description from the Diagram Center is an effort by Benetech to provide guidance to annotators on how best to describe visual information. Regarding charts and graphs, a visual description of the data can be beneficial. The most important aspect of a high-quality alternative text annotation, however, is to add a link with a table representing the data contained in the figure. This guideline and standard formed the foundation for the dataset and competition that Benetech hosted with Kaggle: How might we create a tabular representation of the data depicted in a chart image?
Why AI?
The question is a perfect one for PageAI, a team at Benetech that specializes in applied machine learning to convert inaccessible STEM content into inclusive learning materials for students with disabilities. Our goal was to develop a tool capable of adding tabular descriptions to our converted textbook pages. The tabular format enhances accessibility since it structures information for easier comprehension by assistive technologies and ensures standardization and computability across various devices and platforms. However, transcribing graphs into tables often requires the precise extrapolation of data axes at the pixel level, often involving over 100 data points in a single image. The inherent biases, time constraints, and margin of error associated with human endeavors make this task impractical to implement. This challenge led us to design a dataset using our access to synthetic and extracted textbook images.
Competition Parameters
With this custom dataset, we were able to launch our Kaggle competition. Unlike other datasets that have been used to transcribe tabular data, ours was the first to solely focus on simple graphs typically found in textbooks. Diverging from prior ICDAR competitions, we intentionally decided to work with a smaller subset of graph types to simplify both the annotation and submission scoring process. This targeted approach allowed the chart reading models to focus on fewer tasks overall, leading to more consistently reliable results on simple graphs like the ones appearing in K-12 STEM textbook.
Competition Overview
The Kaggle competition engaged 608 competing teams over three months, with the highest scoring teams submitting a solution that scored 0.88 and 0.72 on the public and private portions of the dataset, respectively. A pool of $50,000 was collectively awarded to the top six participants. Most leading contenders leveraged the DePlot or MatCha models to implement their solutions, with many participants electing to add an object detection model to handle scatter plots – a challenging graph type that often exhibits lower performance with just end-to-end models. Given the complexity, participants used Graphics Processing Units (GPUs) to train the models, often for hours or even days at a time. While models could be trained locally or using distributed computing services, they had to adhere to Kaggle’s submission parameters and guidelines.
Detailed technical explanations of participant solutions, challenges, and strategies were provided at the end of the competition. Below are the top six solutions for the Kaggle competition, please refer to URLs listed below to learn more information about each of the solutions:
The Outcome
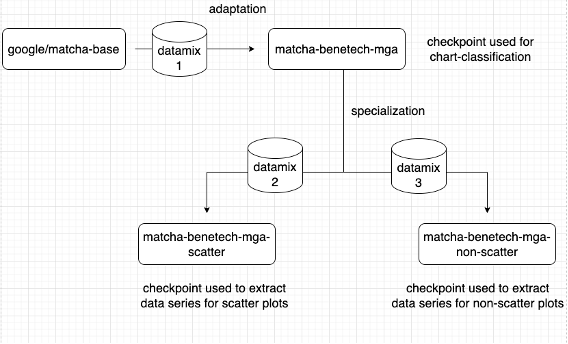
PageAI employs its own internal API to classify and further describe images. Currently, we have decided to integrate the 2nd Place Solution: Hallstatt into PageAI. This solution offers the optimal balance between elegant implementation and model performance due to its use of the same model in all three stages, namely classifier, scatter, and non-scatter. This graph transcription module will significantly enhance the accessibility of automatically converted materials by ensuring high accuracy and reducing the need for extensive human intervention during post-processing.
Key Insights
The Kaggle competition represented Benetech’s first effort in crafting a task-specific dataset for a machine learning challenge, offering valuable insights along the way.
- Notably, high-quality data has a significant impact on model quality. Since usable high-quality real-world data was scarce for our dataset, many participants dedicated time to sift through synthetic data. Their aim was to identify prime examples for illustrating chart transcription tasks and to generate additional data.
- We recognized the pivotal importance of effective communication between annotation teams and developers to establish standards and best practices for creating annotations. While annotation software demonstrations can be helpful, a comprehensive written guide proved to be more effective.
Looking ahead, we hope to enhance our data preparation protocols for both internal and competition-ready datasets, in order to further advance accessibility in STEM learning.
Acknowledgements
Benetech would like to thank Schmidt Futures for their support in making this work possible. Benetech would also like to thank Macmillan Publishers for their contribution to the dataset source material.